x-meansでクラスタリング【python】
CPPXのXです。
pyclusteringというライブラリを使ってx-meansをやってみたいと思います。 x-meansは、k-meansのkを自動推定しつつクラスタリングしてくれる手法です。
x-meansのアルゴリズムの詳細については、別の方が詳しく説明しています。
環境
- python 3.5.3
- pyclustering 0.8.1
pyclusteringはpipでサクッと入ります。
今回使うもの達
import pyclustering
from pyclustering.cluster import xmeans
import numpy as np
import pylab
2次元データ
とりあえずデータを作ります。
データの持ち方は、(データ数, xy) です。
これをクラスタリングします。
data = np.concatenate((
    np.random.uniform(-10, 0,    (100, 2)),
    np.random.uniform(-30, 0,  (100, 2)) + [0, 50],
    np.random.uniform(-30, -20,  (100, 2)),
    np.random.uniform(-60, -30,  (100, 2)) + [-50, 30],
    np.random.uniform(-50, -40,  (100, 2)),
    np.random.uniform(-60, -50,  (100, 2)) + [50, 0],
    np.random.uniform(-70, -60,  (100, 2)),
    np.random.uniform(-80, -70,  (100, 2)) + [-30, 10],
    np.random.uniform(-90, -80,  (100, 2)),
    np.random.uniform(-100, -80, (100, 2)) + [70, 0],
    ), axis=0)
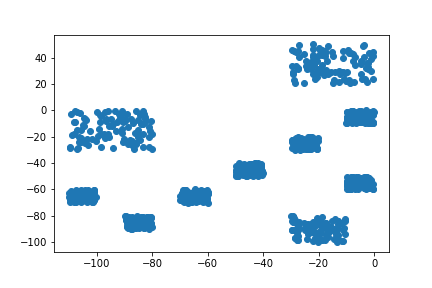
以下のような適当に作ったデータです。

では、クラスタリングします。
初期値は、k-means++による初期値決定を行います。
init_center = pyclustering.cluster.xmeans.kmeans_plusplus_initializer(data, 2).initialize() # 初期値決定 今回は、初期クラスタ2です
xm = pyclustering.cluster.xmeans.xmeans(data, init_center, ccore=False)
xm.process() # クラスタリングします
ccore=Trueにすると、処理にc/c++が使われて早くなるみたいです。
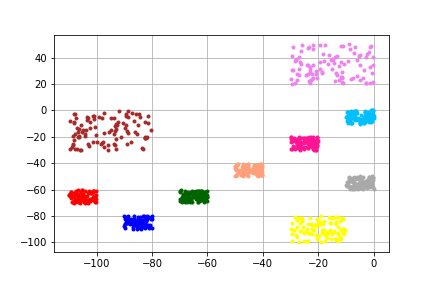
可視化するには、pyclusteringで用意されてる関数を使うと楽です。
clusters = xm.get_clusters()
pyclustering.utils.draw_clusters(data, clusters)

描画にはmatplotlibが使われています。
showさせたくない場合は、display_result=Falseにするといいです。
3次元データ
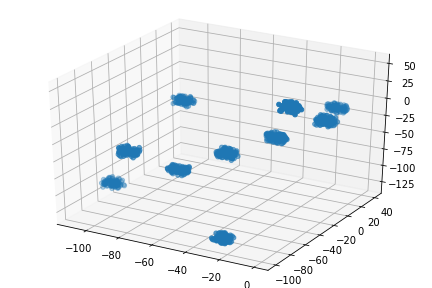
データを3次元にすると、あとは勝手にやってくれます。
data = np.concatenate((
    np.random.uniform(-10, 0,    (100, 3)),
    np.random.uniform(-20, -10,  (100, 3)) + [0, 50, 0],
    np.random.uniform(-30, -20,  (100, 3)),
    np.random.uniform(-40, -30,  (100, 3)) + [-50, 20, 30],
    np.random.uniform(-50, -40,  (100, 3)),
    np.random.uniform(-60, -50,  (100, 3)) + [50, 0, 100],
    np.random.uniform(-70, -60,  (100, 3)),
    np.random.uniform(-80, -70,  (100, 3)) + [-30, 10, -30],
    np.random.uniform(-90, -80,  (100, 3)) + [0, 0, 50],
    np.random.uniform(-100, -90, (100, 3)) + [70, 0, -30],
    ), axis=0)

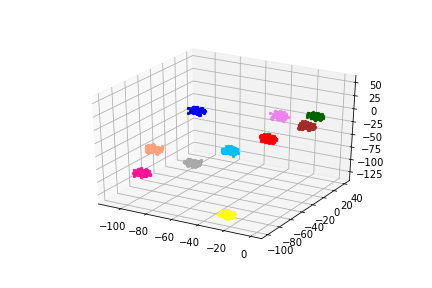
これにx-meansかけると、

良さげです。
クラスタリング部分のソースコードは2次元の時に使ったものそのままで大丈夫です。
描画は1~3次元までしか出来ませんが、クラスタリング自体は何次元でも出来ると思います。
irisデータセットの一部にやってみる
可視化する関係上、使うデータを以下の3つに絞ります
- sepal length (cm)
- sepal width (cm)
- petal length (cm)
from sklearn import datasets
iris = datasets.load_iris()
iris.data.shape, iris.target.shape

using = (0, 1, 2)
data = iris.data[..., using]
正解ラベル付きで表示しています。
このデータにx-meansをあててみます。


ほう
今回自分が使ったコードまとめ
おわりです
最後に、今回使ったコードをまとめて貼っておきます。
グラフ表示部分も含めておきました。
2次元
#%% imports
import pyclustering
from pyclustering.cluster import xmeans
import numpy as np
import pylab

#%% create data 2d
data = np.concatenate((
    np.random.uniform(-10, 0,    (100, 2)),
    np.random.uniform(-30, 0,    (100, 2)) + [0, 50],
    np.random.uniform(-30, -20,  (100, 2)),
    np.random.uniform(-60, -30,  (100, 2)) + [-50, 30],
    np.random.uniform(-50, -40,  (100, 2)),
    np.random.uniform(-60, -50,  (100, 2)) + [50, 0],
    np.random.uniform(-70, -60,  (100, 2)),
    np.random.uniform(-80, -70,  (100, 2)) + [-30, 10],
    np.random.uniform(-90, -80,  (100, 2)),
    np.random.uniform(-100, -80, (100, 2)) + [70, 0],
    ), axis=0)

pylab.scatter(data[..., 0], data[..., 1])
pylab.savefig("./data.png")
pylab.show()

#%% clustering
init_center = pyclustering.cluster.xmeans.kmeans_plusplus_initializer(data, 2).initialize()
xm = pyclustering.cluster.xmeans.xmeans(data, init_center, ccore=False)
xm.process()
clusters = xm.get_clusters()
pyclustering.utils.draw_clusters(data, clusters, display_result=False)
pylab.savefig("./data2.png")
pylab.show()
3次元
#%% imports
import pyclustering
from pyclustering.cluster import xmeans
import numpy as np
import pylab
from mpl_toolkits.mplot3d.axes3d import Axes3D
import matplotlib
import matplotlib.pyplot as plt

#%% create data 3d
data = np.concatenate((
    np.random.uniform(-10, 0,    (100, 3)),
    np.random.uniform(-20, -10,  (100, 3)) + [0, 50, 0],
    np.random.uniform(-30, -20,  (100, 3)),
    np.random.uniform(-40, -30,  (100, 3)) + [-50, 20, 30],
    np.random.uniform(-50, -40,  (100, 3)),
    np.random.uniform(-60, -50,  (100, 3)) + [50, 0, 100],
    np.random.uniform(-70, -60,  (100, 3)),
    np.random.uniform(-80, -70,  (100, 3)) + [-30, 10, -30],
    np.random.uniform(-90, -80,  (100, 3)) + [0, 0, 50],
    np.random.uniform(-100, -90, (100, 3)) + [70, 0, -30],
    ), axis=0)

fig = plt.figure()
ax = Axes3D(fig)
ax.scatter3D(data[..., 0], data[..., 1], data[..., 2])
pylab.savefig("./data.png")
plt.show()

#%% clustering
init_center = pyclustering.cluster.xmeans.kmeans_plusplus_initializer(data, 2).initialize()
xm = pyclustering.cluster.xmeans.xmeans(data, init_center, ccore=False)
xm.process()
clusters = xm.get_clusters()
pyclustering.utils.draw_clusters(data, clusters, display_result=False)
pylab.savefig("./data2.png")
pylab.show()
iris
#%% imports
import pyclustering
from pyclustering.cluster import xmeans
import numpy as np
import pylab
from mpl_toolkits.mplot3d.axes3d import Axes3D

#%% load data
from sklearn import datasets
iris = datasets.load_iris()
iris.data.shape, iris.target.shape

#%% plot iris data
using = (0, 1, 2)
iris.feature_names
data = iris.data[..., using]
target = np.concatenate([iris.target[np.where(x == iris.target)] for x in using])

fig = pylab.figure()
ax = Axes3D(fig)
ax.scatter3D(data[..., 0], data[..., 1], data[..., 2], c=iris.target)
pylab.savefig("./data.png")
pylab.show()

#%% clustering 3 data
init_center = pyclustering.cluster.xmeans.kmeans_plusplus_initializer(data, 2).initialize()
xm = pyclustering.cluster.xmeans.xmeans(data, init_center, ccore=False)
xm.process()
clusters = xm.get_clusters()
print(len(clusters))
pyclustering.utils.draw_clusters(data, clusters, display_result=False)
pylab.savefig("./data2.png")
pylab.show()